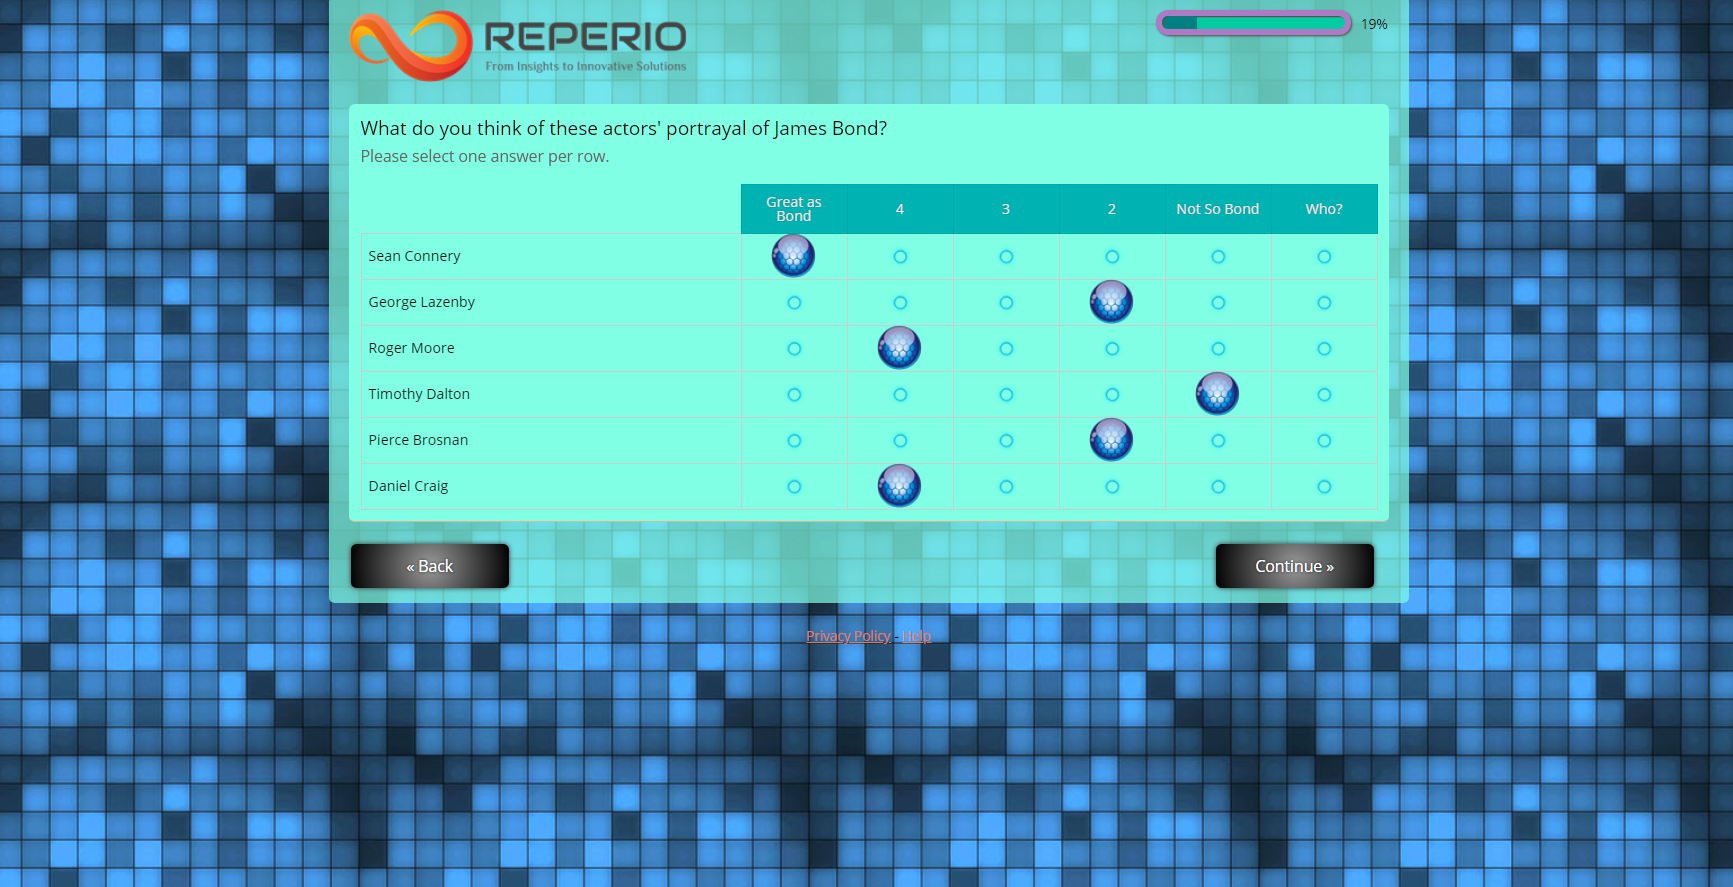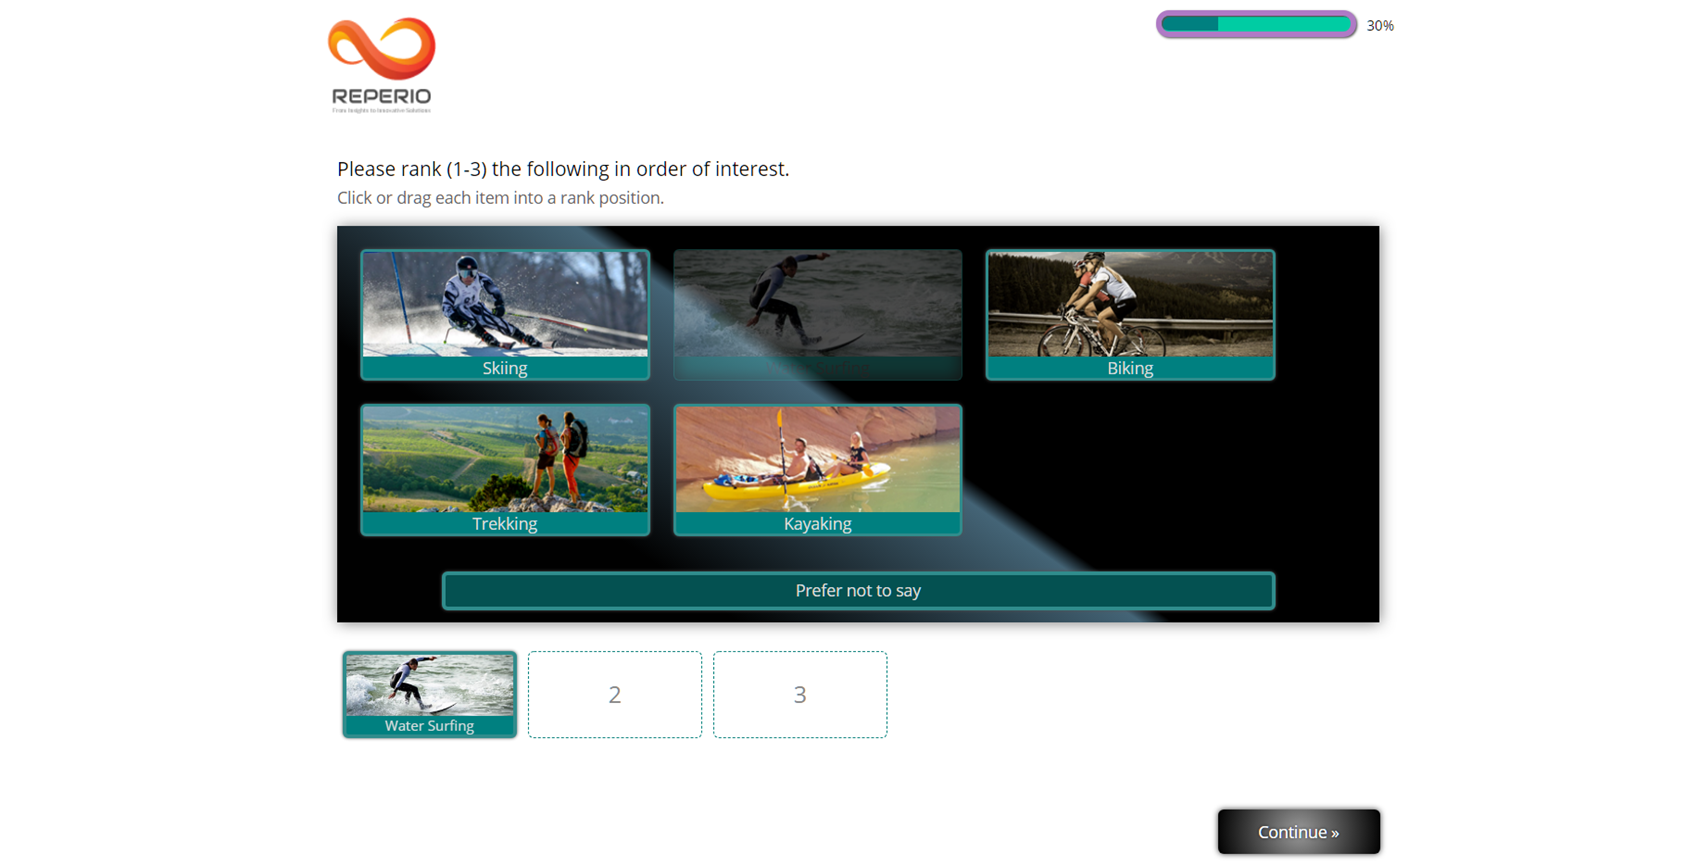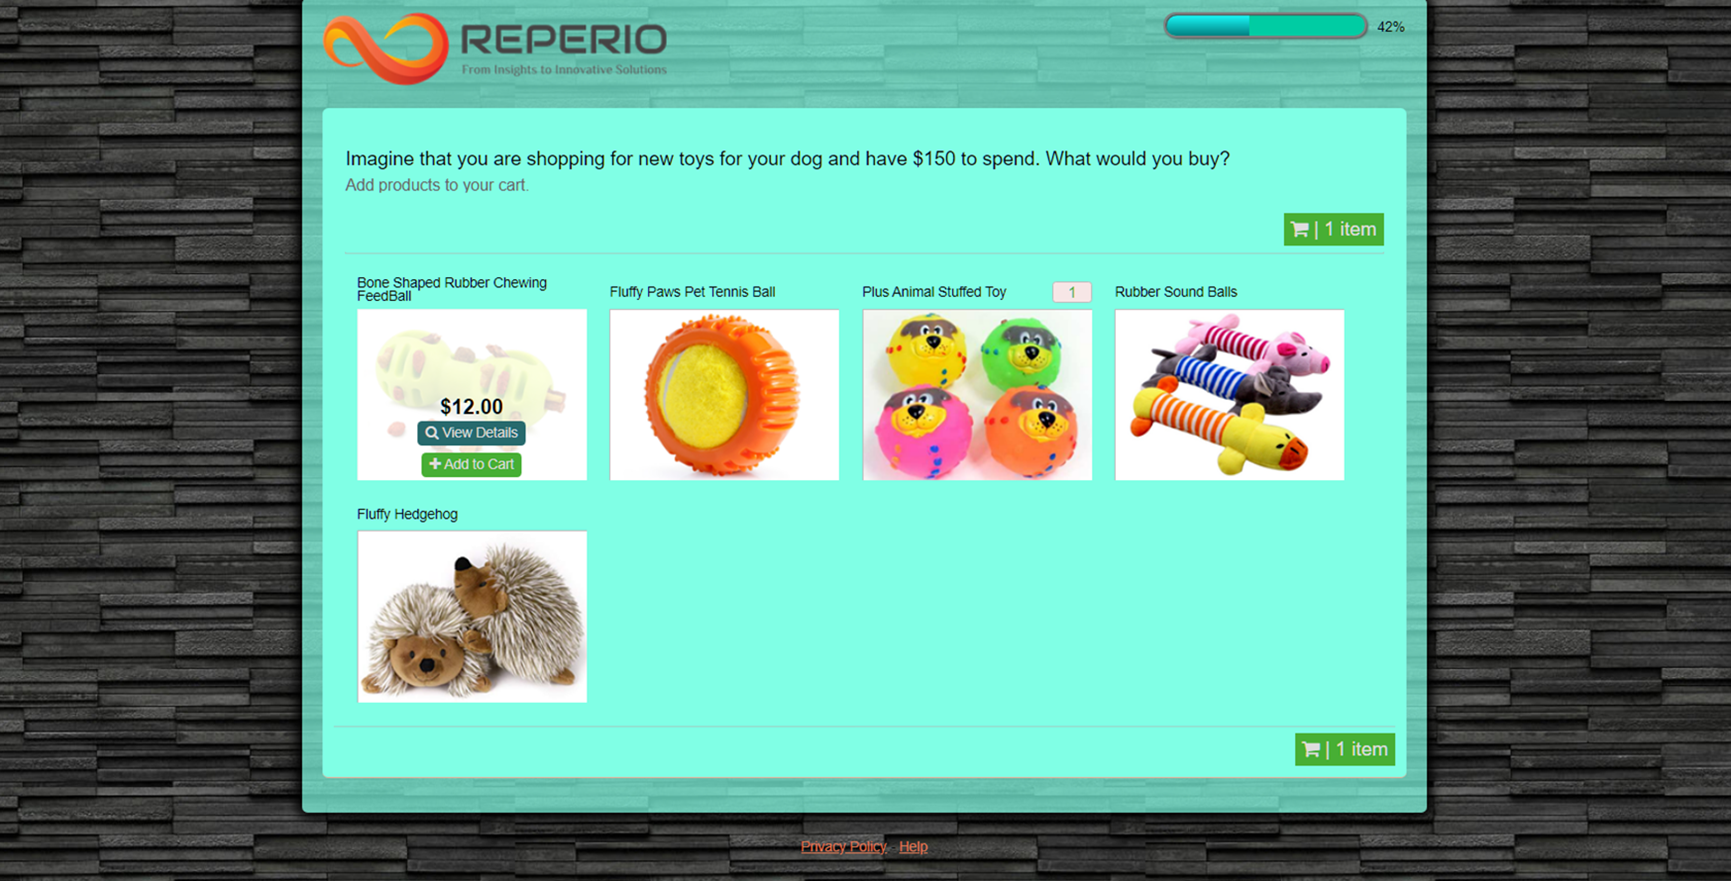
SURVEY PROGRAMMING

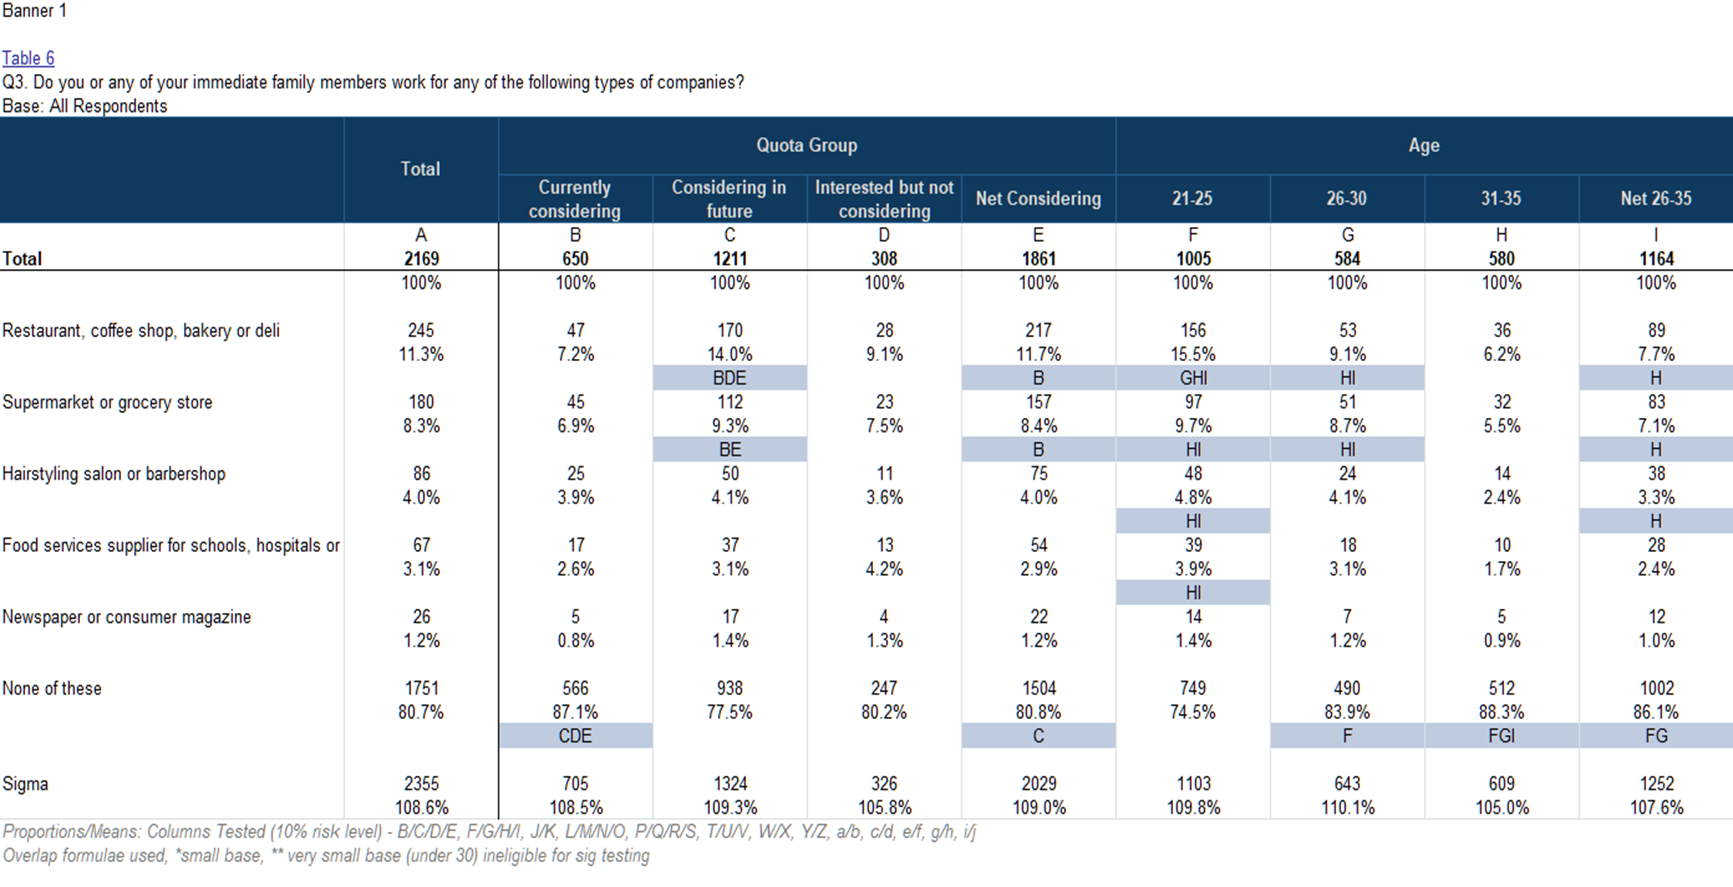
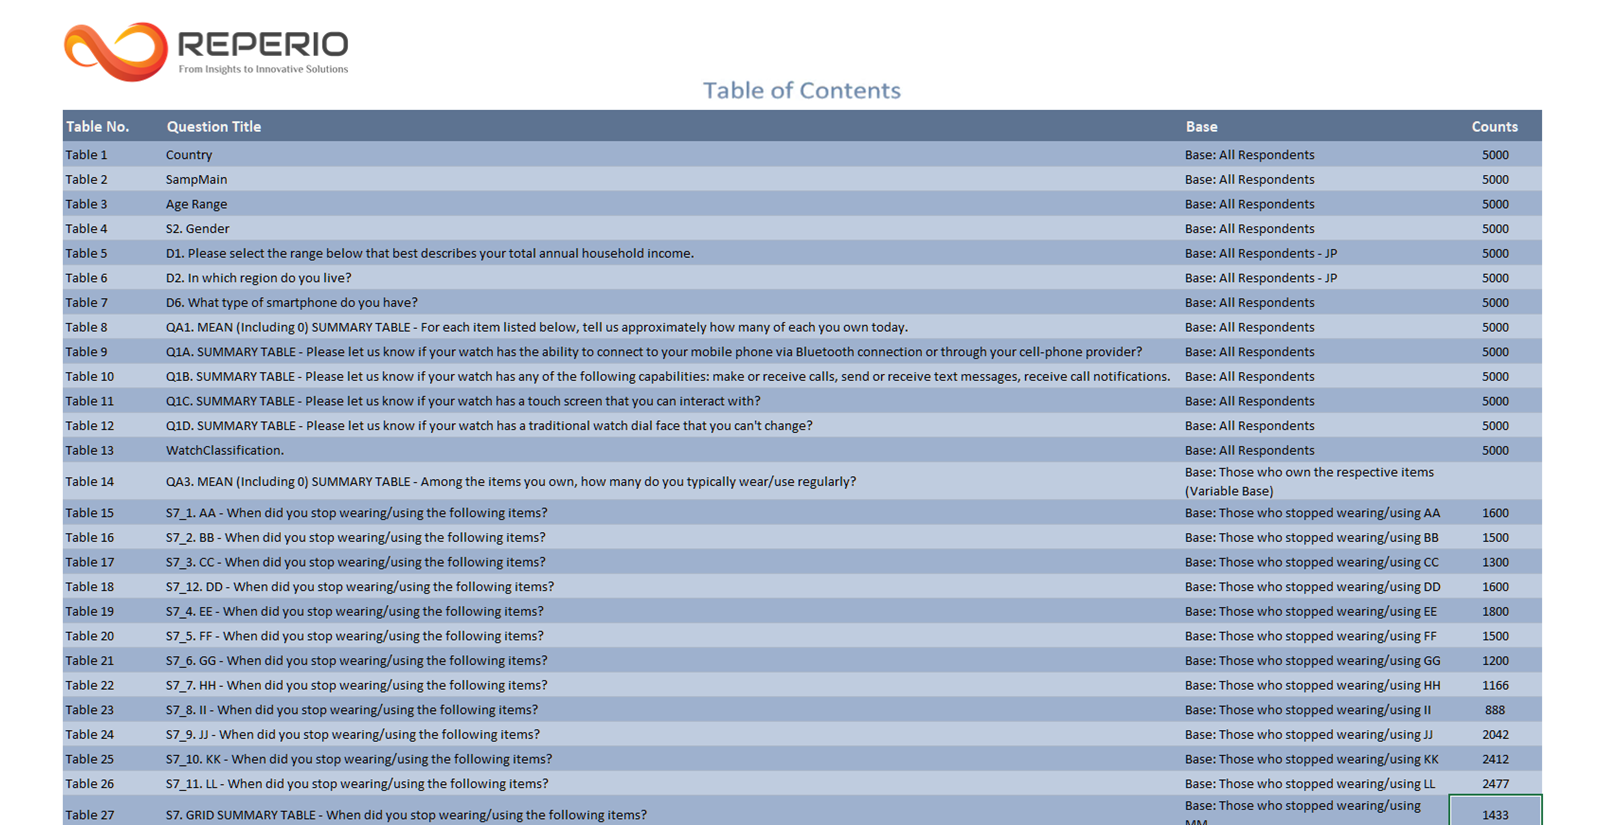
CROSS-TABULATION

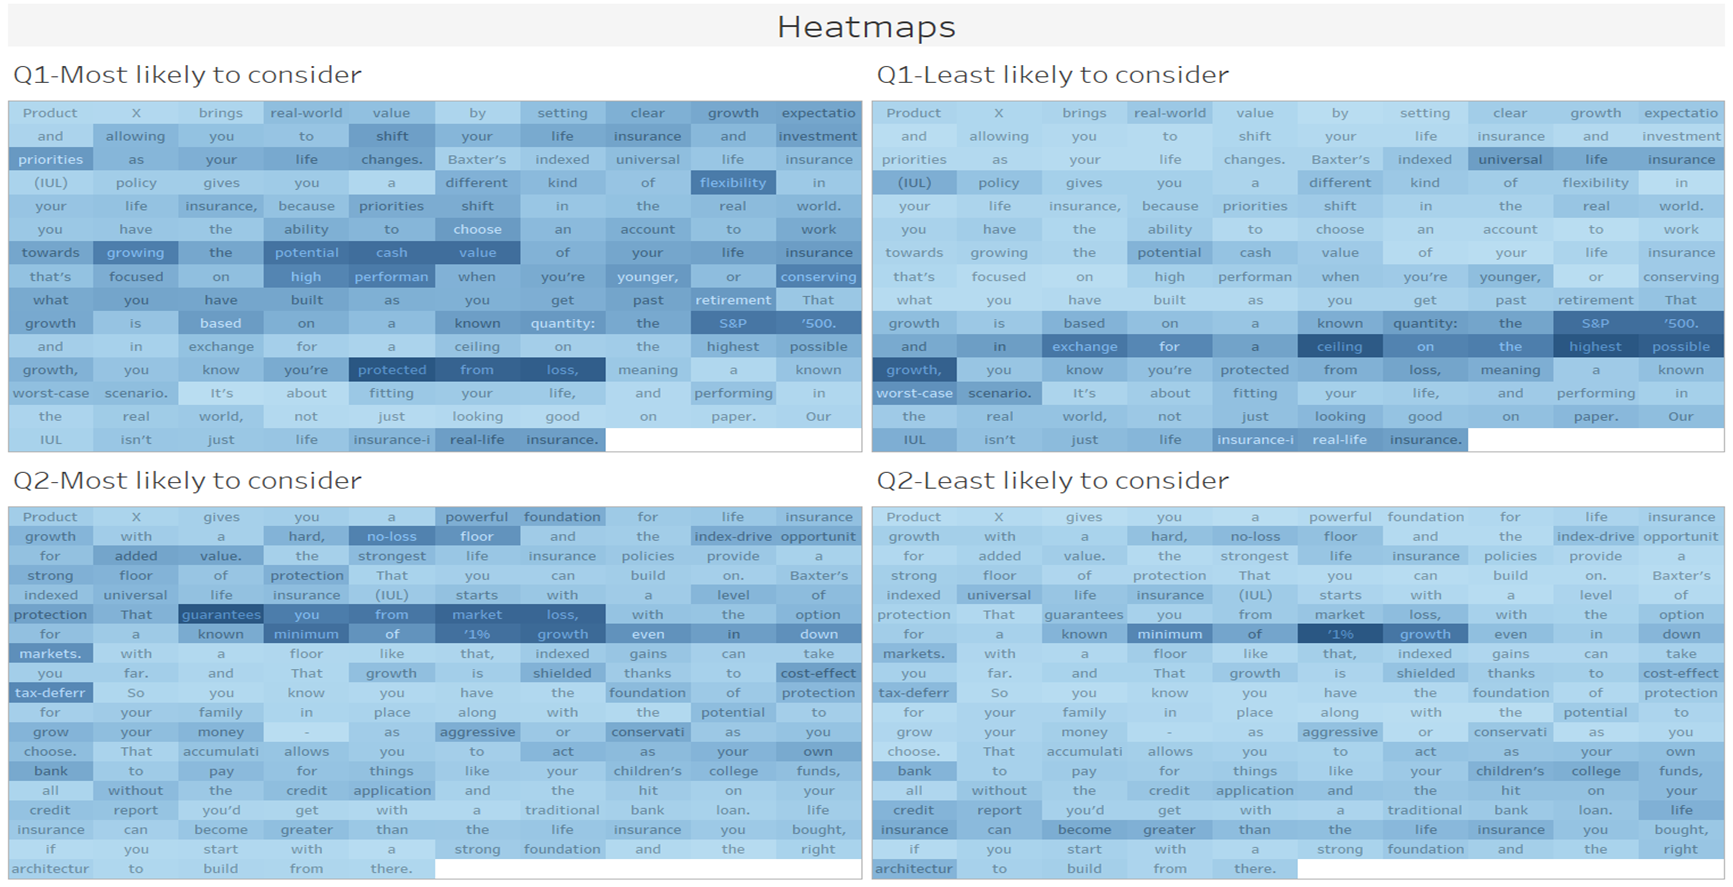
ADVANCED ANALYTICS

DATA MANAGEMENT

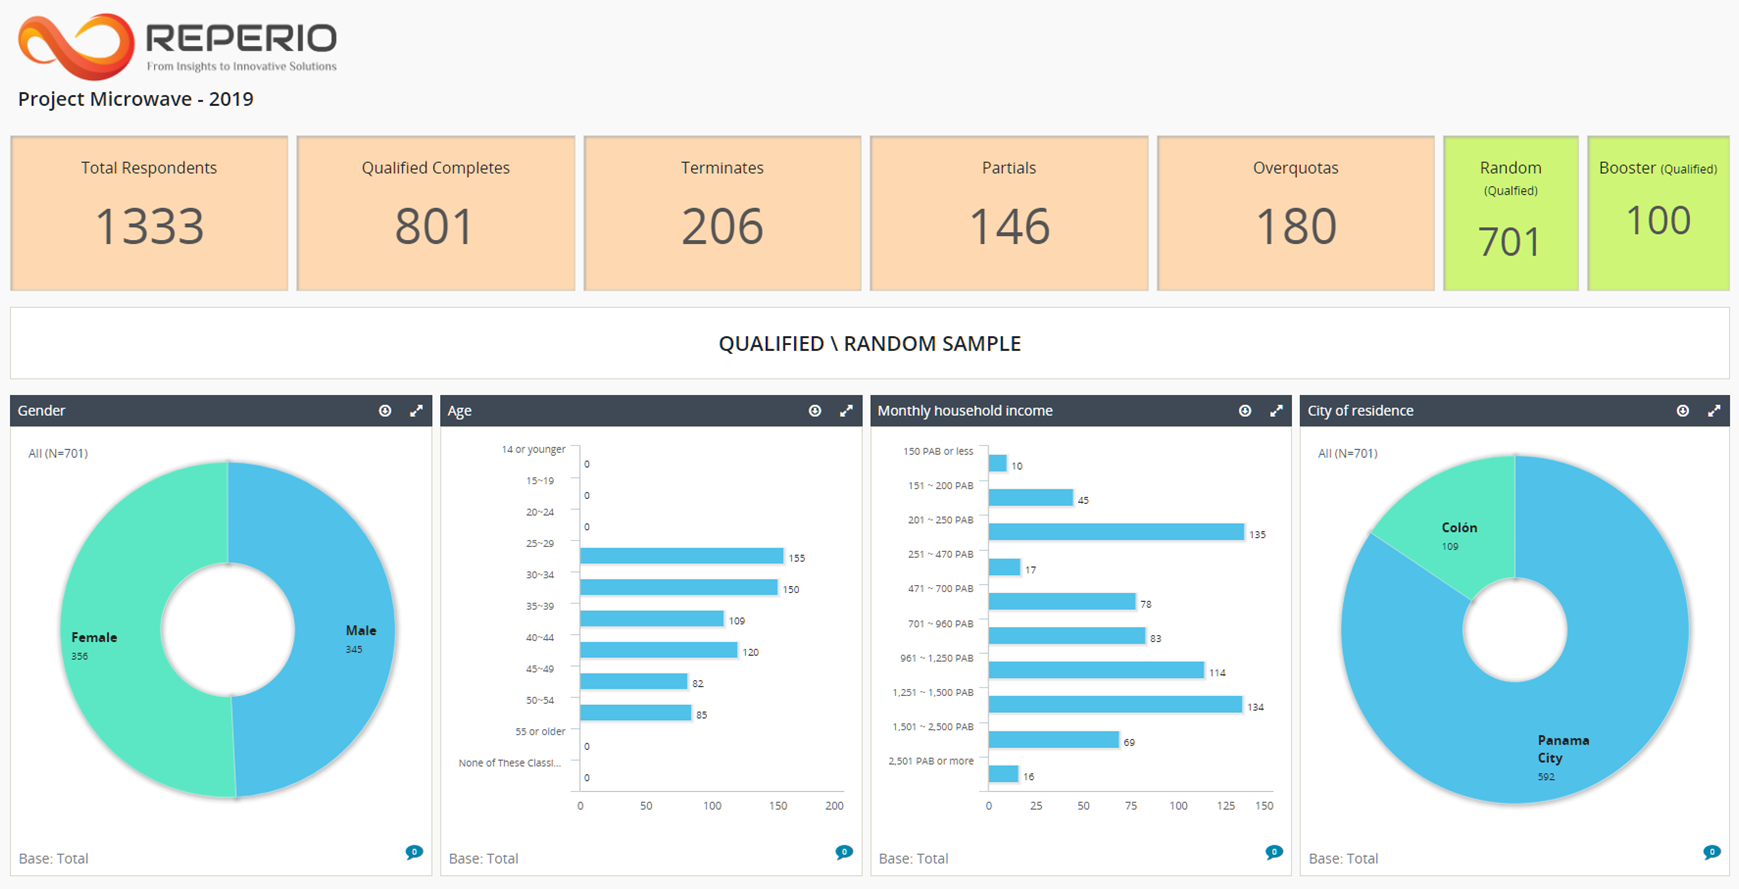
DATA VISUALIZATION

AUTOMATION
SURVEY PROGRAMMING
CROSS-TABULATION
ADVANCED ANALYTICS
DATA MANAGEMENT
DATA VISUALIZATION
AUTOMATION

Reperio, founded in 2014, in New Delhi, India, is an innovative, entrepreneurial, client-focused organization, providing solutions to market research firms across the globe. Reperio is a workplace for highly talented people having expertise in the domain of Survey Programming, Data Processing, Advanced Analytics, Data Visualization, Text Analytics and Automation. We are a team of highly motivated individuals who are fully committed to providing the highest standards of services. Senior leadership includes some of the best talents in the Market Research industry, with very rich experience in diverse functions.
We are a process driven organization which allows for continuous operational growth, efficiency, and organizational knowledge. We establish behaviors around our processes, eliminating redundant steps and automating transactional processes making it more efficient and agile. To ensure that individuals are aligned to the overall organizations objectives, we have rewards and recognition mechanisms in place which reinforce process thinking, as appropriate to individual roles.
We encourage our employees to be customer champions, provoke new thinking, new insights, a new commitment, and new behaviors to keep the customer experience top of mind. Customer satisfaction results are bought to every employees attention at each level, from senior management to production workers. Teams participate in providing valuable inputs on how to improve the results. Re-engineering the process for continuous improvement based on client and employee feedback is an important part of our standard procedures and parties.

We aim to become the most preferred partner of our clients in the domain of Survey Programming & Data Processing services by redefining industry standards on quality & turnaround time through extensive use of automation and latest technologies.
A company is only as good as its people. Reperio Informatics would like to invite on board the brightest minds and innovative thinkers. We’re looking for self motivated people who embrace our core values, are passionate about their work and take pride in contributing to the growth of the company.
| Job Title | Location | Key Skill Set | Work Experience |
|---|---|---|---|
| Tech Lead (SP) | Sohna Road, Gurgaon | Decipher/Python/JQuery | 5+ |
| Data Analyst | Sohna Road, Gurgaon | Quantum/SPSS | 2-4 |
| Associate Data Analyst | Sohna Road, Gurgaon | Quantum, SPSS | 1-2 Years |
| Sr. Survey Programmer | Sohna Road, Gurgaon | Decipher | 3-6 Years |
We are indeed very happy with the reputable and quality deliverables we have received from you over the years of doing business. We cannot begin to quantify the many efforts you have put into our projects just to attain highest quality within tight deadlines. This has continued to assist our business in growing faster as clients have never questioned our data for once. We will like to say a BIG Thank You and wish you a great 2020 year ahead.

I’ve worked with Reperio for several years and they’ve done an excellent job on the countless projects we contracted to do with their team. Always professional, with providing top quality, on-time deliverables including Crosstabs/Regressions/Correlations/Data Validation-Cleaning. The staff is always willing to put in the time to understand the need and provide the right information. I highly recommend this company to anyone.

Reperio has been instrumental in helping Innoprobe Insight script and maintain a series of profilers for our panellists. Their high service quality delivery, responsiveness and fair level of pricing remain the core reasons as to why I am their return client.